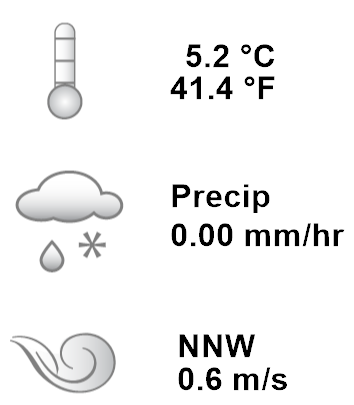
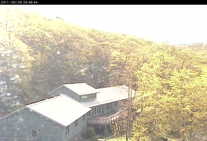
Environmental Monitoring StationsView of Cascade Brook Stream StationThe stream just before the Cascade Brook Stream Station. The wooden box on the left houses the monitoring equipment. Another view from the Fire Tower monitoring stationCascade Brook station radio repeaterThe information that the measurement station collects is relayed to a radio repeater on the Hill of Pines, which sends the data to the Science Center. Measuring rain at the Ridgetop monitoring stationThe rain gauge has a balance measuring device which seesaws back and forth as it fills up with rain water. Each time it spills represents one cubic millimeter of rain water. Open Lowland StationRidgetop StationSolar panels at the Cascade Brook Stream Monitoring StationThe station is powered entirely by solar panels. The forest as seen from the Fire Tower monitoring stationA view from the Fire Tower. View of the Fire Tower monitoring stationMeasuring air speed and direction at the top of the Fire Tower. View of the Ridgetop environmental monitoring stationThe solar panel powers the Ridgetop station. The white tube shaped monitor slightly above it monitors air temperature and relative humidity. Above that are the solar monitors GSAR and PAR and the wind speed and direction monitor. The cage on the bottom right holds the rain gauge. View of the Science CenterThe Science Center monitors outside conditions as well as its consumption of energy. Wind monitors at the Ridgetop environmental sensor stationThe wind speed and direction monitors at the Ridgetop station. Record Type: Forest Story Description: Since 1995, the Black Rock Forest Consortium has integrated into the Forest a network of remote, automated monitoring stations, instrumented with environmental sensors, which continuously measure and record properties of the air, soil and water. The environmental monitoring network currently includes six stations. All the information collected at these stations is automatically sent by radiotelemetry to a base station in the Science and Education Center once each hour. The network can be used in many ways for educational purposes.
A suite of a dozen student activities based on data from the sensors has been developed to help students extend their experience of the Forest beyond the few hours of a typical one-day field trip, and is available on the Lamont-Doherty Earth Observatory web site. Keyword: Environmental Monitoring |
Related Records
Cascade Brook Stream Station
Fire Tower Station
North Slope Oak Forest Station
Open Lowland Station
Ridgetop Station
Science Center Station
|